Monitor your usage and quotas#
Your hub may provide a Usage dashboard where you can check your current resource usage against the quota limits applied to your account.
Where to find the dashboard#
From the JupyterHub homepage (e.g. https://<your-hub-url>/hub/home), open the
Services menu in the top navigation bar and click usage-quota.
Note
Which sections you see on this dashboard is configured per hub. Depending on how your hub is set up, you may see your home storage usage, your compute usage, or both. If you expect to see a section that isn’t there, contact your hub administrator.
Home storage#
This section shows how much of your home directory storage quota you are currently using.
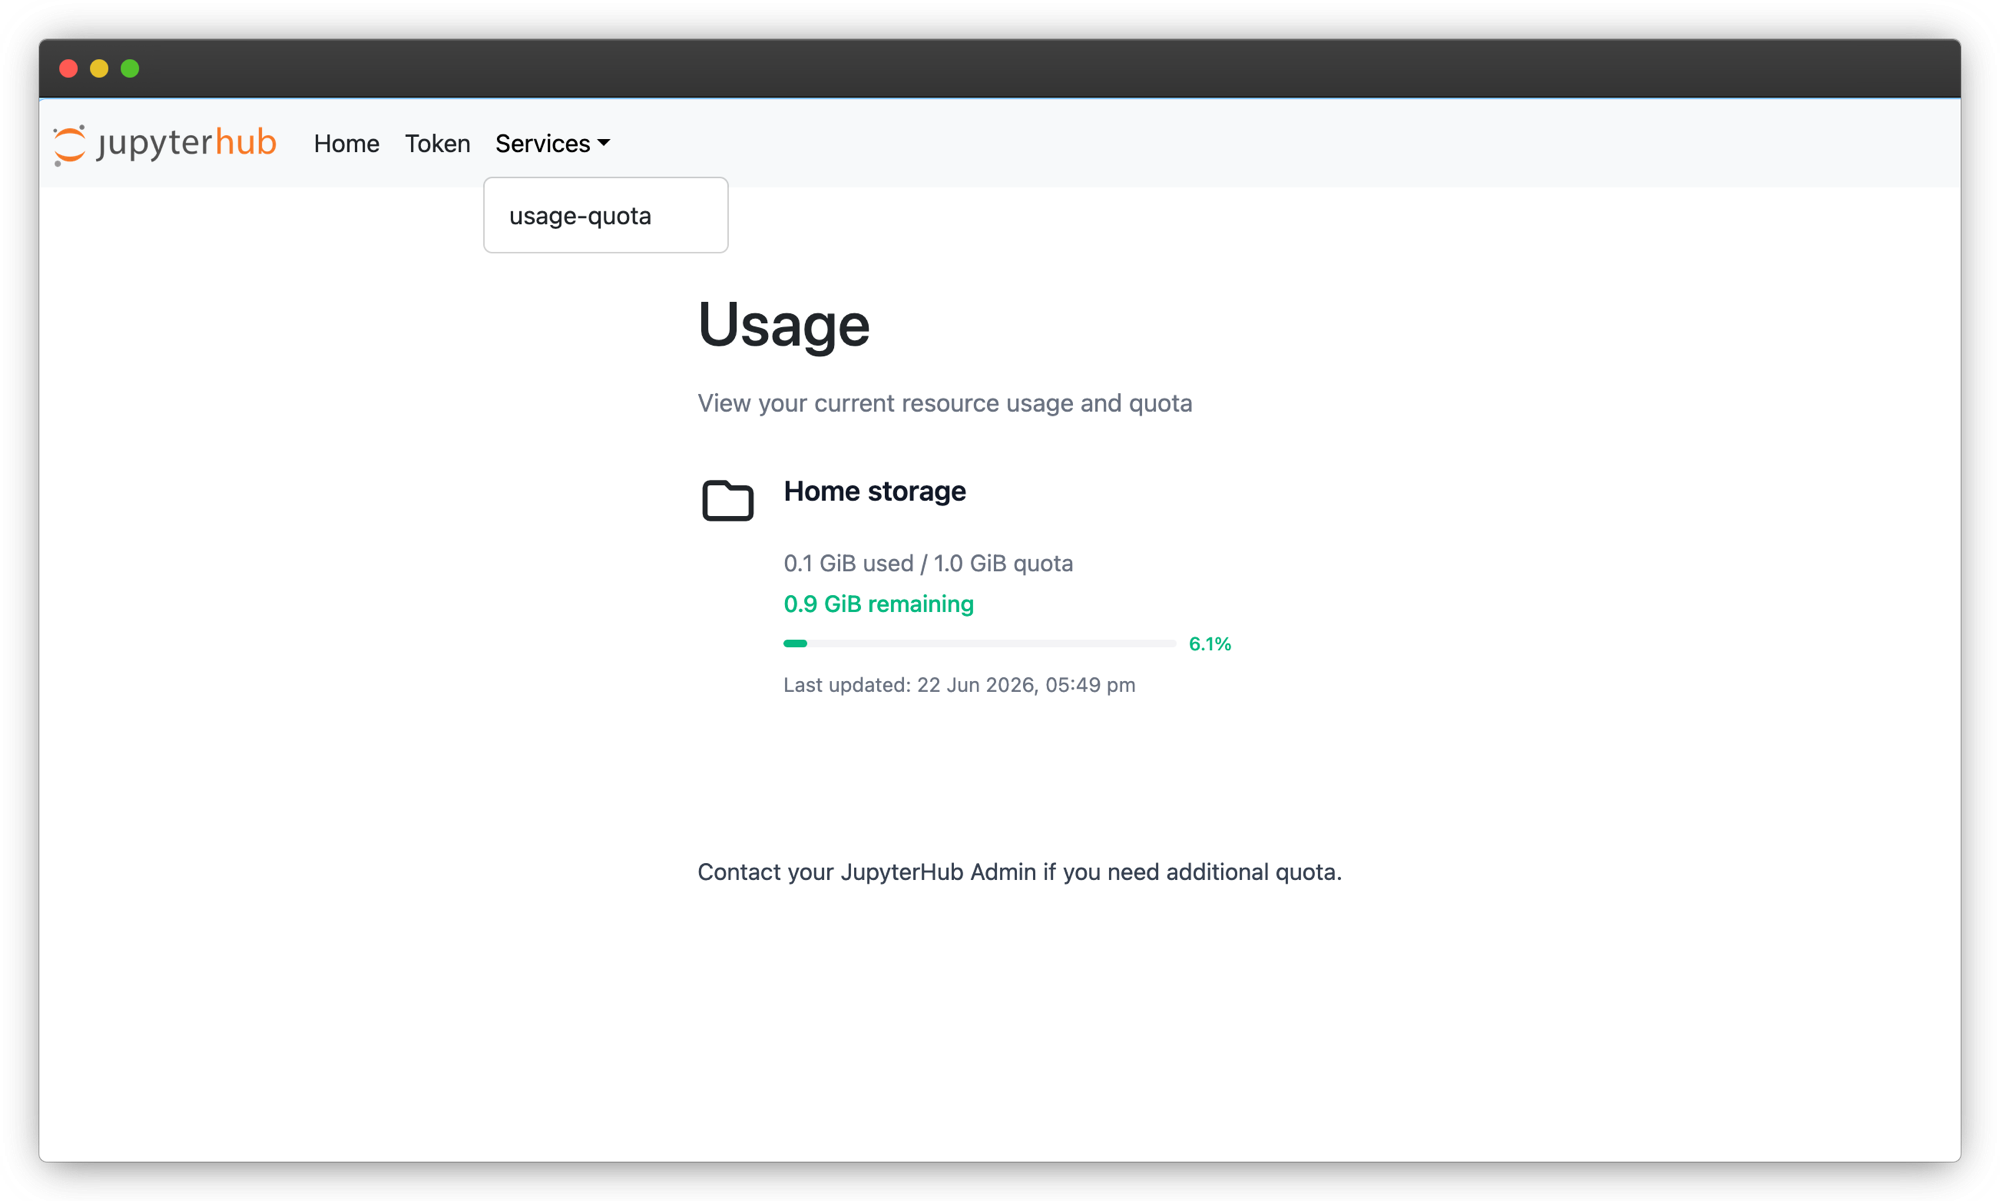
The Usage dashboard, opened from the Services menu. This hub shows the Home storage section only.#
It displays:
Your current usage and your quota limit, in gibibytes (GiB).
The amount of storage you have remaining.
A progress bar showing the percentage of your quota used. The bar is green while you are below 90% of your quota and turns red once you go above 90%.
The time the data was last updated.
Important
The dashboard updates at set intervals, so there may be a short delay between your actual usage and what is shown here.
If you run out of home storage, you may be unable to start your server the next time you try to launch it. To avoid this, free up space in your home directory before you reach your quota. If you are already locked out and cannot start your server, contact your hub administrator for help removing stale data.
For more on how home directory storage works and how to check your usage from a terminal, see Per-User Storage Quotas.
Compute#
This section shows how much of your compute quota you have used over a rolling time window (for example, the last 30 days).
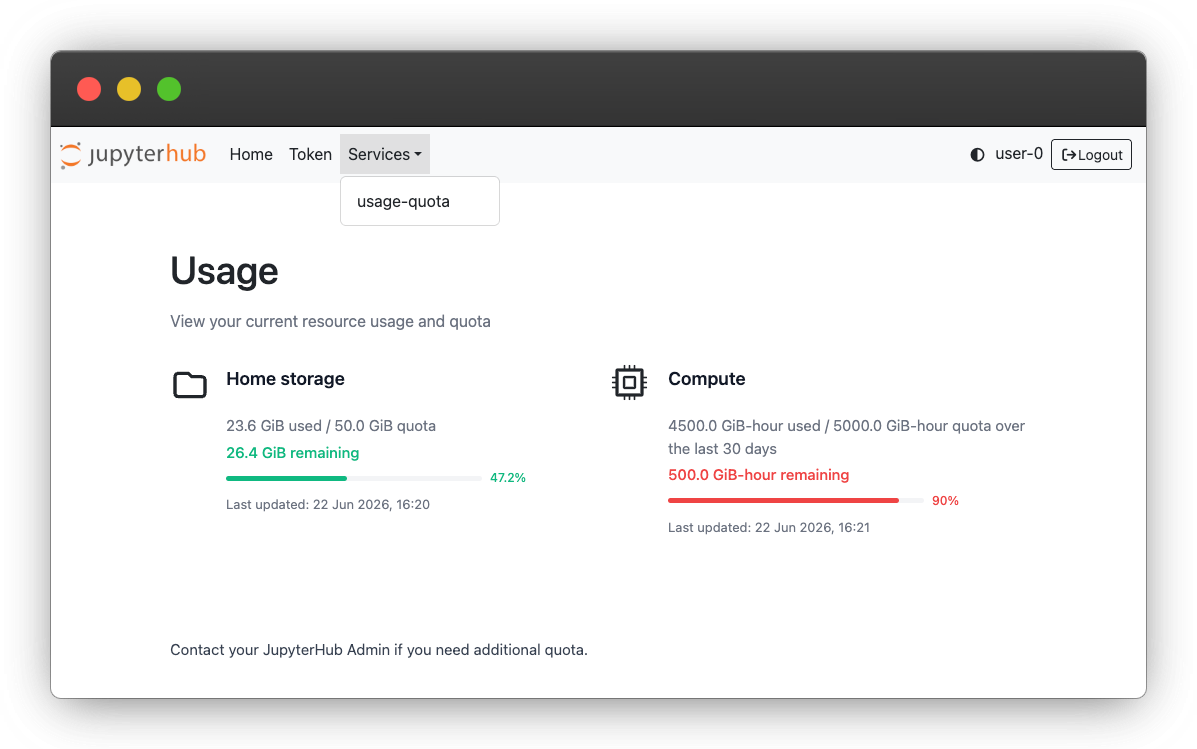
The Usage dashboard. The Compute section is shown on the right; your hub may show one or both sections.#
It displays:
Your current usage and your quota limit, in GiB-hours (gibibytes of memory multiplied by hours of runtime), along with the window the quota applies over.
The amount of compute quota you have remaining.
A progress bar showing the percentage of your quota used. As with home storage, the bar is green below 90% and turns red above 90%.
The time the data was last updated.
If you have more than one compute quota policy applied to your account, click the dropdown icon to expand the section and see the usage and limit for each policy.
If you run out of compute quota, your next server launch will be denied. The compute quota uses a rolling window, so your usage expires gradually rather than resetting all at once. When a launch is denied, the hub shows a retry time indicating when quota will be available to you again. If you need more compute quota, contact your hub administrator.
Troubleshooting#
If a section shows an error instead of your usage, there may be a temporary network issue connecting to the data source. If the problem persists, contact your hub administrator.
References#
Upstream documentation for jupyterhub-usage-quotas